Why do real-time dashboards slow down as data grows? Discover how we built a high-speed streaming pipeline with Confluent, Debezium, and Redshift cutting load times from 40 sec to 2 sec.
In today’s data-driven world, the ability to stream and process data in real time has become crucial for businesses that want to make informed decisions quickly. However, building an efficient and scalable data pipeline that handles real-time data streaming and analytics is no small feat. This blog explores the journey of overcoming performance issues with dashboards and migrating data streaming solutions to Amazon Redshift using Confluent and other tools like Debezium.
Business Impact Overview
- Beyond solving technical challenges, the initiative delivered significant business value across operational, strategic, and leadership levels.
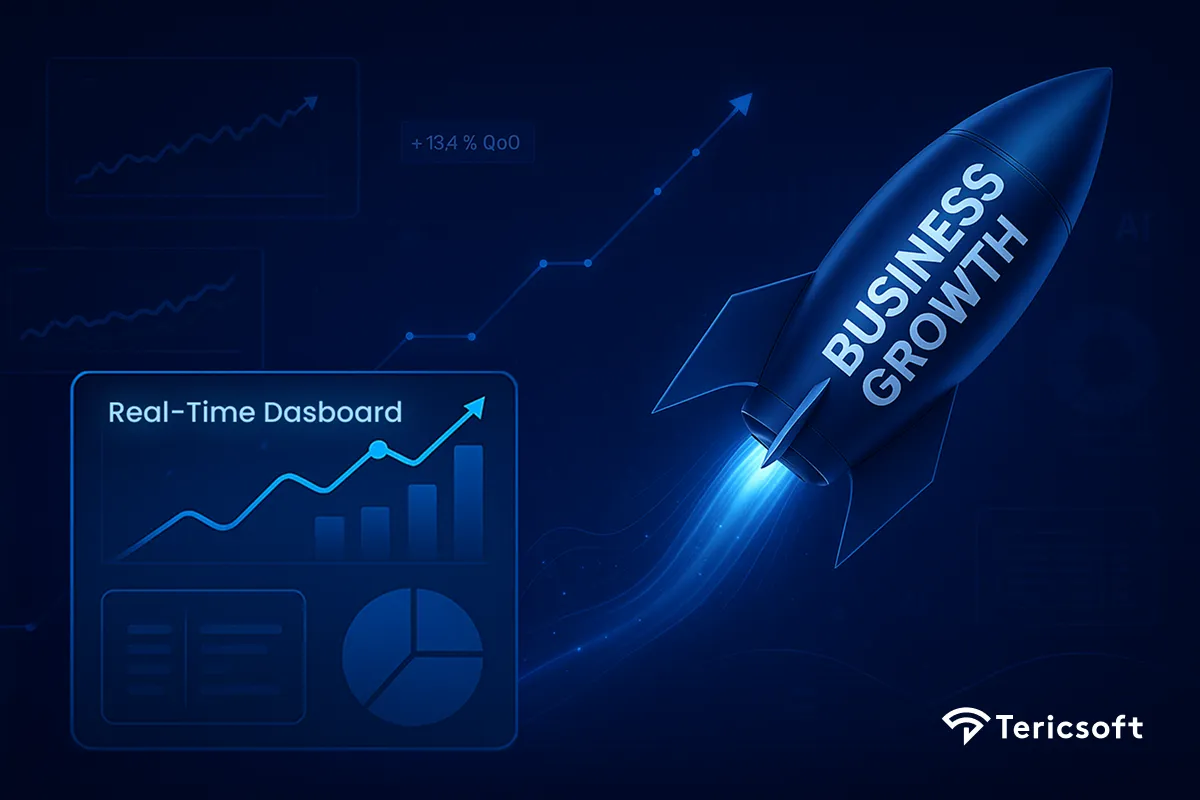
- Previously, dashboards were taking up to 40 seconds to load, leading to delayed reporting and operational slowdowns. By redesigning the real-time data pipeline, load times dropped to 1–2 seconds, minimizing risks related to compliance and decision-making lags. Secure access management was established with distinct roles for Super Admins, Admins, and Users, ensuring enhanced governance and protection of sensitive data.
- The new architecture unified 20+ applications and over 1000 tables into a centralized, real-time warehouse. As a result, leadership teams could make decisions 82% faster, supported by richer datasets and live insights. Operational teams reported a 30% increase in satisfaction due to the ease and reliability of accessing updated information.
- The implementation was designed for rapid adoption with minimal disruption, ensuring that the client began realizing measurable improvements within months. With scalable infrastructure backed by Confluent’s enterprise-grade support and AWS Redshift's performance, the solution future-proofs the client’s data strategy while maintaining reliability and operational confidence.
- This transformation not only improved day-to-day efficiency but also positioned the client for sustained competitive advantage through faster, smarter, and more secure decision-making.
The Challenge: Data Streaming Performance and Scalability
When it comes to real-time data analytics, performance is everything. Our team faced significant challenges when streaming data to analytics dashboards built using Streamlit. As the volume of data increased, the dashboards began to slow down, making it difficult for stakeholders to extract meaningful insights in real time.
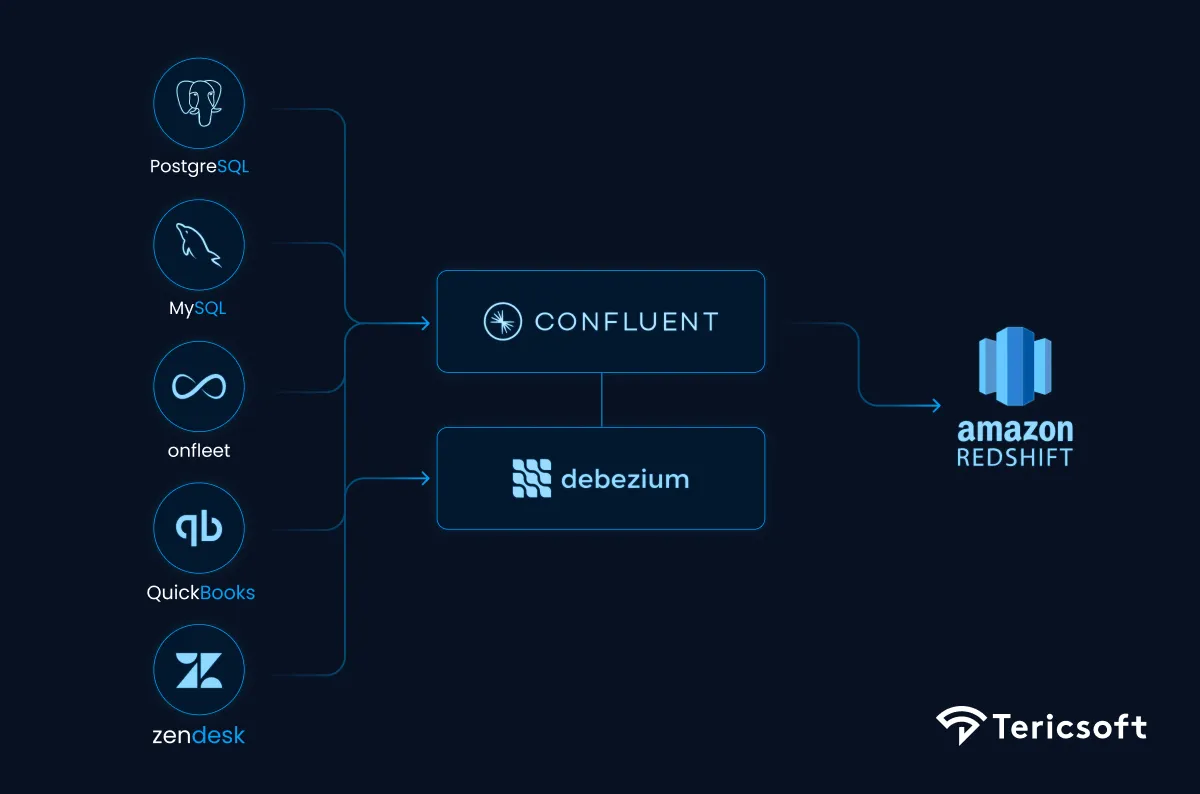
We were streaming data from various sources like PostgreSQL, MySQL, Onfleet, Quickbooks and Zendesk to Redshift. While the initial setup of our data pipeline was functional, we knew that performance bottlenecks were inevitable as the data grew. The need for a more scalable solution became apparent.
Choosing the Right Tool for Real-Time Streaming
In search of a solution, we explored multiple technologies that could help us build a more scalable data pipeline. Among the tools we evaluated were Artiee, AWS MSK (Managed Streaming for Kafka),and Confluent. Each had its own pros and cons, but Confluent ultimately stood out as the best fit for our needs.
- Artiee – Although Artiee’s low-latency data replication and ease of setup initially seemed appealing, it wasn’t suited for our need to handle large-scale real-time transformations. It lacked support for complex transformations and didn’t align with the level of customization we required.
- AWS MSK – AWS Managed Streaming for Kafka (MSK) offered the scalability and reliability we needed, but the complexity of setting up and managing Kafka, coupled with the higher operational costs, made it less ideal for us.
- Confluent – After careful consideration, we chose Confluent, which provides a fully managed Kafka ecosystem. Confluent supports real-time data streaming through Kafka, integrated with Debezium for change data capture (CDC).This solution also provided us with the flexibility to run real-time transformations with ksqlDB, along with robust security features and enterprise-grade support.
Implementing the Solution: Confluent + Debezium for Change Data Capture
To implement a more scalable solution, we integrated Debezium with Confluent to capture changes in data from PostgreSQL and MySQL. The CDC pipeline, powered by Debezium, enabled us to track changes in real time, ensuring that our Redshift destination was continuously updated.
Due to certain limitations in the sink connector (such as not accepting arrays of objects), we had to transform the data before loading it into Redshift. This is where ksqlDB became essential. By using ksqlDB, we performed the necessary transformations and aggregations to modify the data structure into a format suitable for Redshift. This allowed us to address the connector’s limitations and ensure smooth data ingestion while keeping the pipeline efficient.
Outcome: Faster and Scalable Real-Time Analytics
By migrating our data pipeline to Redshift and integrating it with Tableau, we achieved a powerful combination that dramatically improved the performance and accessibility of our data for real-time analytics. Redshift’s scalable and high-performance data warehouse enabled us to process vast amounts of data quickly, while Tableau’s visualization capabilities allowed us to transform that data into actionable insights that could be easily understood by stakeholders.
The real-time streaming from PostgreSQL and MySQL to Redshift created a robust and flexible data pipeline that delivered fresh and accurate data for Tableau dashboards. By using ksqlDB to preprocess and transform the data before loading it into Redshift, we ensured that the data was in the right format and optimized for querying. This allowed us to sidestep limitations of direct streaming into Redshift, such as handling complex data types like arrays, which could otherwise hinder performance.
Redshift’s columnar storage and parallel query execution provided the speed needed to handle large datasets, making sure that Tableau could generate dynamic and responsive visualizations even with complex queries. The integration between Redshift and Tableau was seamless, enabling easy data blending, filtering, and aggregating. This combination empowered our team to monitor KPIs in real-time and make data-driven decisions faster than ever before.
The ability to visualize live data from Redshift in Tableau also meant that our decision-makers could access up-to-date insights on demand, reducing the lag between data collection and action. This improved the overall efficiency of our business processes, allowing us to optimize operations and stay ahead of emerging trends in real-time.
In summary, by combining Redshift and Tableau, we unlocked the full potential of our data. Redshift provided the speed, scale, and flexibility to store and query our data, while Tableau transformed that data into visual stories that empowered our team to make informed decisions faster.

Our Case Study – Optimizing Real-Time Data Streaming and Analytics
Our client, a rapidly growing organization in the analytics and data science sector, faced challenges with processing and analyzing large volumes of data in real time. As their business expanded, the demand for faster and more accurate insights grew. Their initial solution, built using Streamlit dashboards, became increasingly sluggish as the data volume increased. The company required a more robust, scalable data streaming solution to ensure performance and improve the overall user experience.
The Problem
The organization was streaming data from multiple sources (PostgreSQL, MySQL, Snowflake) into Redshift, which served as the central data warehouse. As the volume of data grew, the performance of the dashboards decreased, leading to slow query times and delayed insights. The existing data streaming infrastructure lacked the scalability needed to handle large datasets in real time.
The Objective
The goal was to build a more efficient data pipeline that could:
- Handle large volumes of data in real time
- Improve the performance of data analytics dashboards
- Scale easily as the business grew
- Provide real-time data transformations and processing
Solution Approach
After evaluating several options, we decided to leverage Confluent as the foundation of the new data streaming pipeline, coupled with Debezium for change data capture (CDC). This combination allowed for:
- Real-time data streaming: Kafka was used for high-throughput streaming of data, and Debezium captured changes in source systems (PostgreSQL and MySQL).
- Data transformation: ksqlDB was used to process and transform the data in real time, allowing us to create dynamic dashboards with up-to-date information.
- Scalability and reliability: With Confluent’s fully managed service, we could scale the infrastructure without worrying about maintenance, reducing the operational burden on our team.
Implementation Details
- Data Capture with Debezium: We configured Debezium to stream data changes from PostgreSQL and MySQL to Confluent. This enabled real-time tracking of data changes, ensuring that Redshift was continuously updated with the latest data.
- Data Transformation with ksqlDB: We used ksqlDB for real-time transformations, allowing us to aggregate and process data before sending it to Redshift. This ensured that only the necessary and transformed data was stored inRedshift.
- Redshift Integration: The final transformed data was ingested into Redshift, where it could be queried by the analytics team in real time. This eliminated the need for complex ETL jobs, significantly reducing processing time.
Results
- Improved Performance: The implementation of Confluent and Debezium significantly improved the performance of the data pipeline, resulting in faster dashboard response times.
- Scalability: The new architecture allowed the client to handle increased data volumes without experiencing performance degradation.
- Cost Efficiency: By eliminating the need for complex ETL processes, the client reduced operational costs and minimized infrastructure management.
This case study highlights the importance of selecting the right tools for building scalable and efficient data pipelines. By using Confluent and Debezium, we were able to deliver a real-time data streaming solution that enhanced performance, scalability, and cost-efficiency for the client. With the ability to capture data changes in real time and process them with ksqlDB, the client is now positioned to make faster, data-driven decisions as their business continues to grow.
Conclusion: The Future of Data Streaming & Real-Time Analytics
As data volumes continue to grow exponentially, building efficient, scalable data pipelines becomes increasingly crucial for businesses aiming to stay competitive. By integrating Redshift for high-performance data warehousing and Tableau for intuitive, dynamic visualizations, we’ve been able to create a seamless data ecosystem that empowers our team to analyze and act on real-time data.
For businesses looking to optimize their data pipelines, leveraging Redshift's scalable infrastructure alongside Tableau's powerful visualization capabilities offers a significant advantage. Real-time analytics is no longer a luxury; it has become an essential component of modern decision-making, enabling organizations to gain valuable insights and react to market changes swiftly.
By combining Redshift's speed and scalability with Tableau's ease of use, businesses can enhance their ability to monitor KPIs, uncover trends, and make data-driven decisions faster than ever. This combination not only boosts operational efficiency but also ensures companies remain agile in today’s fast-paced and data-centric world.

Real-time data streaming is the continuous processing and delivery of data as it's generated, enabling instant insights and decisions.
It improves decision-making, enhances user experience, reduces latency, and supports data-driven growth through live analytics.
Popular tools include Confluent, Kafka, and Debezium for capturing, processing, and syncing live data efficiently across systems.
Debezium captures real-time database changes and streams them to Kafka topics, keeping systems synchronized without manual updates.
Confluent simplifies Kafka management, ensures scalability, reliability, and helps build enterprise-grade streaming data pipelines.