How do large fleets recover hidden utilization? Learn how operators calculate earning hours, identify idle capacity, and improve dispatch efficiency without adding more vehicles.
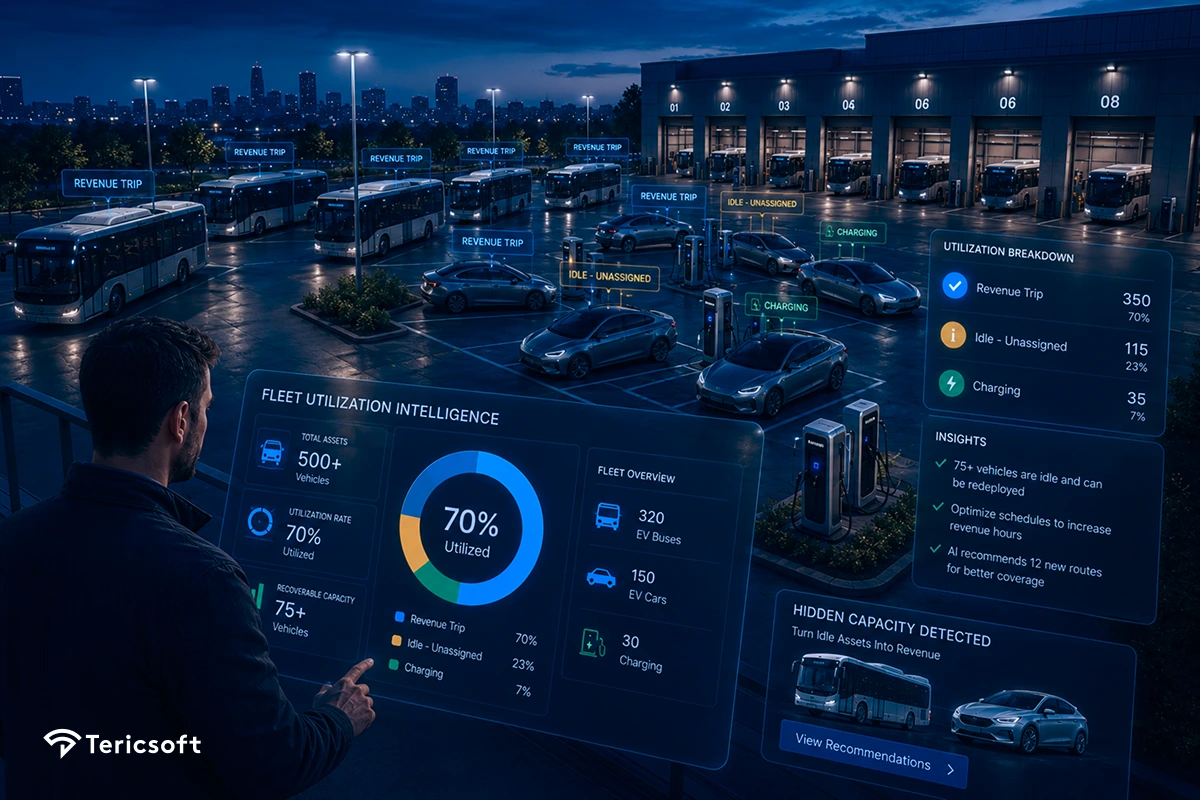
A 500-vehicle fleet running at 70% utilization is effectively operating 150 vehicles for free. EMIs paid, drivers salaried, parking costs accruing. At a typical commercial vehicle total cost of ownership in India, those 150 idle vehicles represent roughly Rs. 12 to 18 crore of unproductive capital per year.
Most operators at this scale know the fleet is underutilized. Almost none know by how much, or where the idle hours concentrate. The reason is almost never missing GPS. GPS tells you where a vehicle is, not whether it is earning. Operators who conflate these two have the data. They have the wrong question.
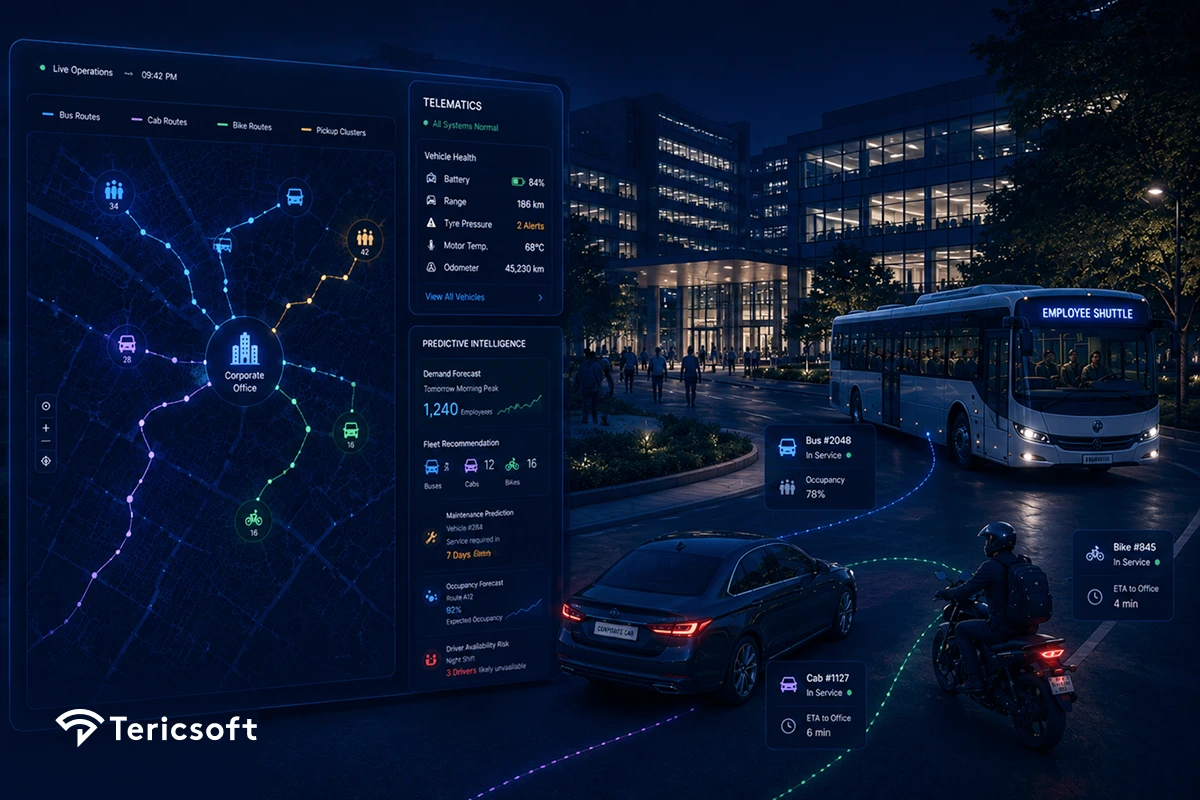
Tericsoft built the technology platform behind Srinivasa Travels' three-vertical mobility operation. When we unified the fleet across tours, corporate shuttles, and airport transfers onto a single dispatch platform, utilization improved by roughly 15%. No vehicles were purchased. The fleet was identical. The dispatch intelligence was not.
Fleet Utilization Rate: What 75 to 85% Means and Why Your Fleet Is Probably Below It
The utilization number most large operators quote is simultaneously correct and misleading. Correct because it uses actual trip data. Misleading because it counts engine hours rather than earning hours, and reports a single fleet average that conceals the distribution beneath it. Both errors point in the same direction: they make the fleet look better than it is.
For most operations above 500 vehicles, the reported number overstates actual productive utilization by 5 to 10 points. That gap is not a rounding error. At scale, it represents tens of crores of capital generating no return.
How to Calculate Fleet Utilization: Revenue Hours, Not Engine Hours
The fleet utilization formula is simple. Applying it correctly requires discipline about what counts.
Fleet utilization rate = (revenue-earning vehicle hours / total available vehicle hours) x 100
Worked example: one vehicle, one day. Available hours after scheduled charging and maintenance: 20. Hours on revenue trips, meaning carrying a paying load or passenger: 11. Utilization = 55%.
Two inputs operators consistently get wrong:
- Engine-time is not earning-time. A vehicle driving empty to a pickup consumes fuel and driver hours. It produces nothing. Count only hours where the vehicle carries a paying load
- The fleet average hides the distribution. A fleet averaging 75% often contains a top quartile running at 92% and a bottom quartile at 51%. The top quartile cannot be pushed further. The bottom quartile is where the opportunity lives. The average prevents operators from seeing which vehicles to investigate
For commercial passenger and logistics fleets, 75 to 85% of available hours is the healthy range. Below 70%, significant capital is unproductive. Above 90%, the fleet is typically under-sized, which makes operations brittle: any demand spike or maintenance spike produces SLA failures because there is no absorption capacity. An operator running above 90% is not well-optimized. They are exposed.
Fleet Utilization Rate Insight: The operators most confident in their utilization numbers are often the ones measuring the wrong thing. A fleet average derived from engine hours and reported monthly produces a number that finance can use and operations cannot. The number that operations can use is a vehicle-level breakdown, measured in revenue hours, delivered daily. These are different measurements. Only one of them changes dispatch behaviour.
Fleet Management Metrics: Why GPS Tracking and Utilization Are Different Things
A telematics feed and a utilization dashboard run on the same GPS signal. What separates them is classification. One tells you position. The other tells you what that position is costing the business every hour it persists.
Most large fleet operations have telematics. Most do not have utilization classification. The gap between these two capabilities is where idle time becomes invisible, and invisible idle time cannot be acted on.
Fleet Performance Metrics: The Daily Scorecard Operators Are Missing
On a standard fleet map, a vehicle waiting at a hub for its next assigned trip and a vehicle that dispatch has no assignment for look identical. A stationary dot. Without trip-state classification, no system can distinguish between them, which means no person can act on the difference.
Five states every vehicle should be classified into at every moment:
- En route to pickup
- On revenue trip
- Repositioning between assignments
- Charging or in scheduled maintenance
- Idle-unassigned
The fifth state is where money disappears. It is also the only state that a tracking system without classification logic cannot surface. Every hour a vehicle spends in idle-unassigned is an hour of EMI, driver salary, and parking cost with no corresponding revenue. At scale, finding and eliminating that state is worth more than marginal optimizations to the vehicles already earning.
Fleet Performance Metrics Insight: Fleet performance metrics are only operational when they reach the right person at the right frequency. A monthly fleet average reaches finance. A daily vehicle-level scorecard, ranked worst-first, reaches the depot operations head with enough time to act on it the same day. The reporting structure determines whether the data produces decisions or just documents.
Vehicle Utilization: Why Demand Sits in One Depot While Vehicles Idle in Another
At scale, the vehicle utilization problem is rarely about total fleet shortage. It is almost always about mismatch. The vehicles exist in the wrong place, or they are invisible to the demand that needs them.
Srinivasa Travels operated tours and leisure travel, corporate employee transport, and airport transfers as three separate operations with three separate dispatch systems. The corporate shuttle fleet idled between morning and evening peaks. The leisure-travel desk turned away bookings for lack of vehicles. Both conditions were simultaneously true. Neither team could see the other's fleet position because the systems did not share data.
The cross-vertical dispatch correction required no additional hardware and no longer runway. It required making fleet supply visible across a boundary that each vertical's dispatch team had previously treated as fixed. Unifying all three verticals onto a single platform was worth approximately 15% utilization improvement.
The mechanism is repeatable. Before committing to vehicle procurement to cover demand in one vertical, the first question to ask is: what is the idle rate in the other verticals during that same window? In most multi-vertical operations, the answer reveals that shared capacity already exists. Procurement is the most expensive response to a visibility problem.
Cross-Vertical Dispatch Insight: Adding vehicles to cover a utilization gap is a permanent capital commitment. Improving dispatch visibility across verticals costs a fraction of that and often recovers more capacity. At Srinivasa Travels, the 15% lift represented the equivalent of 75 additional vehicles. No vehicle was purchased. The value came from making existing supply visible to demand it could not previously see.
Fleet Dispatch Software: Why Utilization Is a Daily Decision, Not a Monthly Report
Most large fleet operations are asking the wrong question. The MIS deck answers: 'what was our fleet utilization last month?' The question that changes anything is: 'which vehicle, in which depot, failed to earn this morning, and why?'
These are not the same question answered at different frequencies. They are different questions that require different systems and reach different people. The monthly report reaches finance and leadership. The daily vehicle-level scorecard reaches the depot operations head. Only one of them can do something about idle hours while those hours are still happening.
Every day of discovery delay on an underperforming vehicle cluster is a day of EMI, parking, and driver cost producing no revenue. On a cluster of 20 vehicles running at 40% utilization, that delay costs real money every morning it repeats. The monthly average conceals this. The daily ranked scorecard surfaces it.
Fleet dispatch software that delivers a daily worst-first vehicle ranking by depot does not create more demand. It creates the conditions for dispatch decisions that were previously impossible because the relevant data arrived too late.
Fleet Dispatch Insight: A daily scorecard is not a reporting upgrade. It is a decision architecture change. The COO who sees which depot ran worst yesterday at 7am can call the operations head before the shift starts. The one who reads last month's average cannot recover a single idle hour. The cadence of reporting determines the cadence of action.
Improve Fleet Efficiency: The Utilization Intelligence Layer
Software rarely creates fleet capacity. It exposes capacity that already exists. The distinction matters when operators are evaluating technology, because it changes what they should be asking for.
The right question is not: what does this system add to my fleet? It is: what does this system make visible that dispatch currently cannot see? Operators who buy fleet management software expecting it to generate demand will be disappointed. Operators who use it to classify idle time, match latent supply to unserved demand, and surface daily underperformance will recover the margin that was already there.
The three components Tericsoft builds on top of an operator's existing telematics:
- Trip-state classification: every vehicle-hour labeled automatically across five states. Revenue, repositioning, charging, maintenance, idle-unassigned. Idle time becomes measured, attributable, and actionable rather than simply part of the fleet average
- Demand-supply optimization engine: live demand from bookings, rosters, and trip requests matched against live fleet supply across depots and verticals. Redeployment recommendations arrive while the window to act on them is still open
- Daily COO scorecard: vehicle and depot performance ranked worst-first, every morning. The COO who acts on yesterday's idle data at 7am recovers those hours. The one who reviews last month's average recovers none
What the Numbers Look Like
The pattern holds across Tericsoft's fleet operator engagements. Not because of platform features, but because of what becomes possible when idle time is classified, matched to unserved demand, and surfaced at operational frequency.
- 15% fleet utilization improvement at Srinivasa Travels from cross-vertical dispatch unification. The vehicles already existed
- 98%+ real-time visibility across Lithium Urban's 3,000+ electric vehicles, the data foundation that utilization accounting requires
- 10%+ fleet productivity improvement across EV fleet engagements
- 50% faster operational decision-making after COO reporting shifted from next-morning summaries to live data
On a 500-vehicle fleet, recovering 15 utilization points frees approximately 75 vehicles of equivalent capacity. At Rs. 10 lakh annual total cost of ownership per vehicle, that is Rs. 7.5 crore of annual capital cost avoidance. It comes from software and operational discipline. Not from procurement.
The infrastructure required to operate at this scale, processing 1B+ API calls per month across 3,000+ vehicles, is documented in the Lithium Urban EV fleet case study.
Key Lessons
Four observations from building the technology behind Srinivasa Travels' cross-vertical platform and Lithium Urban's EV fleet intelligence layer. Each one reflects a decision where correctly framing the problem changed the economic outcome.
Measure Earning-Time, Not Engine-Time
Revenue hours over available hours is the only utilization metric that maps to capital efficiency. Every other measure (ignition time, GPS pings, engine hours) describes activity without distinguishing whether that activity generated revenue.
Operators who shift from engine-hour measurement to revenue-hour measurement typically discover their actual utilization is 5 to 10 points below what they have been reporting. That gap is not a measurement technicality. It is real capital sitting idle.
Attack the Bottom Quartile, Not the Average
The fleet average blends vehicles that are already near-optimally deployed with vehicles that are producing almost nothing. Improving the average requires finding and fixing the latter. The average, by construction, conceals which vehicles those are.
On a 500-vehicle fleet, the bottom quartile is 125 vehicles. At Rs. 10 lakh annual TCO per vehicle, that is Rs. 12.5 crore of capital worth understanding before committing to procurement. A daily worst-first scorecard surfaces this. A monthly fleet average does not.
Utilization Improves When Dispatch Teams Get Daily Data, Not When Finance Teams Get Monthly Averages
The frequency at which utilization data reaches operations determines the frequency at which operations can act on it. Thirty days between data and decision means thirty days of unrecoverable idle hours per cycle.
The operators who improve utilization consistently are the ones who have changed the reporting cadence, not just the reporting content. The data already exists. The decision architecture around it is what changes the outcome.
Shared Capacity Beats New Capacity
Procurement is the most expensive response to a utilization problem. It commits capital permanently to what may be a temporary or structural visibility gap that technology can close for a fraction of the cost.
In every multi-vertical fleet operation Tericsoft has worked with, cross-vertical dispatch has recovered 10 to 15 utilization points before a single additional vehicle was required. The capacity was already there. The visibility was not.
Find Your Hidden Fleet
If you operate 500 or more vehicles and your utilization number comes from a month-end report, the idle capacity is already there. It is not yet visible, attributable, or actionable. That is the gap.
Tericsoft's free Ops Intelligence Brief maps your utilization curve from existing telematics data. It identifies where idle hours concentrate, which depots carry the most unproductive capacity, and what the recovery looks like before any technology commitment is made.
About Tericsoft
Tericsoft builds fleet intelligence and technology platforms for large-scale mobility operators in India. The work covers utilization intelligence layers, demand-supply optimization engines, and daily fleet performance dashboards built on top of existing telematics infrastructure.
- 15% fleet utilization lift at Srinivasa Travels through cross-vertical dispatch unification
- 98%+ real-time visibility for Lithium Urban's 3,000+ EV corporate fleet
- 50% faster operational decision-making across fleet engagements after shifting to live data
- Utilization intelligence built from existing GPS and telematics data, no new hardware required

For commercial fleets, 75 to 85% of available vehicle hours is healthy. Below 70% leaves capital idle. Above 90% usually signals an under-sized fleet.
Divide revenue-earning vehicle hours by total available hours, then multiply by 100. Count only paid trips and track it daily per vehicle.
No. GPS shows location, not earning state. It takes trip-state classification, demand-supply matching across depots, and daily dispatch reporting.
Visibility arrives in weeks once trip-state classification runs on existing telematics. Gains follow in one to two quarters as dispatch acts on it.
Every 10 points lost on a 500-vehicle fleet is about 50 vehicles of capital, EMI, and driver cost earning nothing. Recovery comes from software.