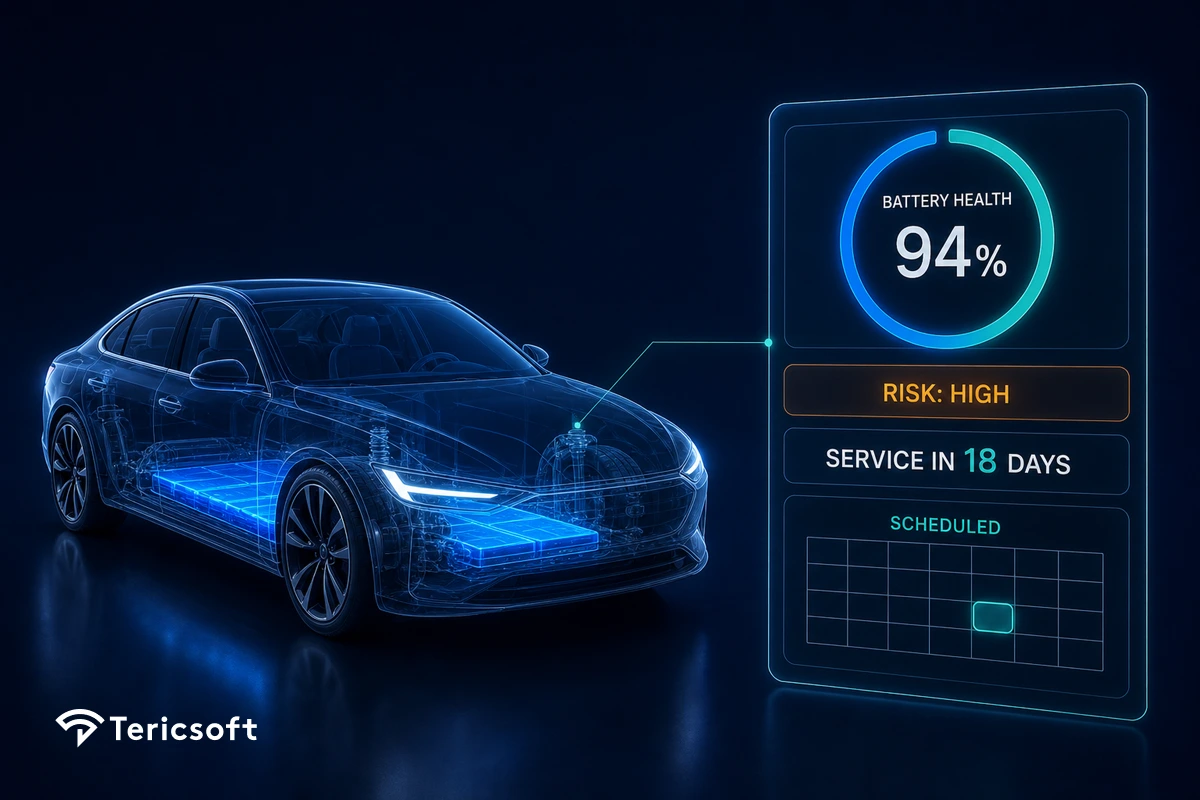
What are the fleet management KPIs that actually change how a fleet runs? Fourteen metrics, each with a formula, a benchmark, and the person who owns it, from live operations to maintenance KPIs and unit economics.
Most fleet management KPI lists are written backwards. They name twenty metrics, assign no owner, and set no threshold, which produces a dashboard specification rather than an operating system. In a real operation running hundreds or thousands of vehicles, a fleet management KPI earns its place only when three things are true at the same time. Someone specific owns it. A threshold defines what counts as bad. And something happens automatically when that threshold is crossed. This guide covers fourteen fleet management KPIs that meet all three tests, each with a formula, a benchmark, and an owner, drawn from platforms we run in production, including one that processes more than one billion telemetry events every month across a fleet of over three thousand electric vehicles.
Fleet management metrics vs fleet management KPIs: the difference
Every KPI is a metric, but not every metric is a KPI. A fleet metric is any number you can measure, such as total kilometres driven or litres of fuel burned. A fleet management KPI is the smaller set of fleet management metrics tied to a decision and an owner. Metrics describe the fleet. KPIs change how it runs. The practical test is simple. If a number moves and nobody is required to do anything, it is a metric, not a KPI. Everything below is chosen because a specific person acts on it at a specific threshold.
Three properties separate a KPI that changes behaviour from a chart that decorates a report.
- An owner. Every metric belongs to one role at one altitude. Supervisors act in minutes, operations heads act across days, and leadership acts across weeks. Each KPI below carries its owner.
- A threshold. A utilization figure is information. A rule that says utilization below 70% for three days triggers a depot review is management.
- A consequence. If a breach waits for a human to notice a dashboard, the programme is a reporting programme. Wire each threshold to an escalation, a notification, then a message, then a phone call.
Cost and financial KPIs
These fleet management metrics decide profitability. They are owned at the leadership and operations level and read weekly or monthly.
1. Cost per kilometre and per seat kilometre. The number you bid contracts on, so it has to come from measured telemetry and actual cost, not an annual average. You cannot price a contract with a figure you compute once a year.
Owner: leadership. Formula: total operating cost divided by total kilometres. Benchmark: market specific. For context, the American Transportation Research Institute put the average cost to operate a truck in the United States at 2 dollars and 34 cents per mile in 2025, the highest since the series began. (ATRI, 2025)
2. Total cost of ownership. The lifetime cost of a vehicle, used to decide when to replace it. A vehicle can look cheap on utilization while quietly becoming the most expensive asset in the fleet.
Owner: leadership. Formula: purchase price plus energy plus maintenance plus insurance plus financing, minus resale value, across the vehicle life. Benchmark: retire a vehicle once its cost per kilometre crosses the fleet median and keeps rising.
3. Fuel and energy efficiency. For diesel fleets this is fuel cost per kilometre. For electric fleets it is energy cost per kilometre, and it rewards charging discipline. The costliest habit is opportunistic fast charging in expensive peak windows instead of cheaper off peak windows.
Owner: operations head. Formula: fuel or energy cost divided by kilometres. Benchmark: flag any vehicle whose energy cost per kilometre sits more than 15% above the fleet median.
4. Maintenance cost per vehicle. Repair and service spend per unit, used to find aging outliers and recurring failures before they become breakdowns.
Owner: operations head. Formula: total maintenance spend divided by the number of vehicles. Benchmark: watch the top decile of spenders. Repair and maintenance was among the fastest rising line items in United States trucking in 2025, up 8.6% in a single year. (ATRI, 2025)
Utilization and uptime KPIs
These are owned at the supervisor and operations level and read best in real time.
5. Fleet utilization rate. The share of available capacity that is actually earning. Track the bottom quartile of vehicles rather than the average, because the average hides the vehicles that are quietly earning nothing. Even a one percent drop in utilization can cost a large fleet thousands of dollars a month. (Ryder) The full method is in our fleet utilization guide.
Owner: operations head. Formula: revenue earning hours divided by available hours. Benchmark: 75% to 85% for commercial fleets. Most large operators in India start in the sixties.
6. Vehicle uptime and availability. The share of fleet days a vehicle is available for service. Keep unplanned downtime separate from scheduled maintenance, because the two have different fixes.
Owner: operations head. Formula: available fleet days divided by total fleet days. Benchmark: 95% or higher. Every point below that is roughly five vehicles in every five hundred doing nothing.
7. Vehicles offline or not reporting. The share of the fleet reporting live telemetry at any moment. The offline slice is where tampering, device failure, and trip leakage concentrate, so every offline vehicle should raise an alert rather than sit in a report.
Owner: supervisor. Formula: vehicles reporting live divided by total fleet. Benchmark: above 98% reporting at any moment.
8. Idle unassigned vehicles. Vehicles that are available, fuelled or charged, and earning nothing right now. This is the single most actionable number in the operation, and it should reach the dispatcher as a live count, worst depot first.
Owner: supervisor. Formula: available vehicles with no active assignment, counted live by depot. Benchmark: drive it toward zero during peak demand windows.
Maintenance KPIs
Maintenance KPIs are where reactive fleets lose the most money without seeing it. Two KPIs carry this section, and both are owned by the operations head.
9. Preventive maintenance compliance rate. The share of scheduled services completed on time. Missed preventive maintenance is the leading cause of breakdowns that were entirely avoidable.
Owner: operations head. Formula: preventive maintenance services completed on time divided by services due. Benchmark: 95% or higher.
10. Planned versus breakdown maintenance ratio. This one number describes the health of your whole maintenance strategy. Each breakdown avoided saves two to four vehicle days, and by industry estimates a single day of unplanned downtime for a commercial vehicle costs between 448 and 760 United States dollars. (Fleet Maintenance)
Owner: operations head. Formula: planned work orders divided by total work orders. Benchmark: reactive fleets run near fifty fifty, and predictive operations push past eighty twenty.
Common maintenance KPI examples that sit alongside these two include mean time to repair, mean time between failures, and, for electric fleets, battery health degradation per vehicle, which tracks the costliest component on the balance sheet. Choose two or three, not ten. More maintenance metrics without thresholds reduce action rather than increase it. See how the predictive shift works in predictive fleet maintenance.
Safety and driver KPIs
These are owned by the supervisor and acted on within minutes.
11. Active safety alerts. Overspeeding, route deviation, panic or SOS, and harsh driving. The value is in the response time, not the count.
Owner: supervisor. Formula: share of critical alerts acknowledged within the target window. Benchmark: 100% acknowledged within minutes, with unacknowledged critical alerts escalating automatically, an application push, then a message, then a phone call.
12. No shows and trip failures. Both driver no shows and, in employee transport, employee no shows, which silently destroy seat utilization and billing accuracy. A parked vehicle without a driver is operationally a breakdown, so driver attrition, fill rate, and time to first trip belong beside this number.
Owner: supervisor. Formula: failed trips divided by scheduled trips today, split by cause. Benchmark: track the trend daily and wire recruitment funnel speed to it.
Service level agreement compliance sits across safety and operations. Measure it continuously against each contract rather than at month end, because penalties compound quietly. In one operation we mapped, exposure on unwatched service metrics reached 4.2 lakh rupees a day.
Fleet performance metrics for unit economics
The fleet performance metrics that decide survival live at the leadership altitude and are read weekly or monthly.
13. Revenue per vehicle per day. The number that decides survival in an owned fleet model. Segment it by vehicle type, site, and business model. The spread across the fleet matters more than the mean.
Owner: leadership. Formula: total revenue divided by the count of vehicles multiplied by days. Benchmark: model specific. Rank vehicles and sites by the spread, then fix the bottom decile.
14. Profitability at five levels. Vehicle, driver, site, customer, and business. Fleet level profit hides unit level losses. An eight percent overall margin routinely contains customers at minus five percent. If you cannot rank customers by true margin, at least one of them is negative right now.
Owner: leadership. Formula: revenue minus fully loaded cost, computed at each of the five levels. Benchmark: every customer and site ranked by true margin.
The meta KPI: decision latency
The time from a KPI breach to a human action. It is unfashionable and decisive, because it determines whether the other fourteen change anything. Dashboards alone leave this measured in hours. Escalation agents that push, then message, then call the accountable person collapse it to minutes. Across our engagements, live operational intelligence has cut decision time by about half. See the pattern in the AI COO for fleet operations.
The fleet KPI benchmark list
A benchmark is only useful next to an owner.
Why fleet KPI programs still fail
- The data cannot be trusted. KPIs computed across a dozen disconnected systems disagree with each other, and teams learn to argue with the number instead of acting on it. The prerequisite is one normalized data model across every OEM and device.
- Metrics carry no threshold. A utilization chart is information. A rule that turns a reading into a review is management.
- Nothing happens automatically. A breach that waits to be noticed is a report, not a control. Wire thresholds to escalation, notification, then message, then phone call.
Key lessons
- A KPI needs an owner, a threshold, and a consequence, otherwise it is a chart.
- Assign every metric to an altitude. A metric at the wrong altitude is noise.
- Distrust averages. The bottom quartile of vehicles, the worst depot, and the one negative margin customer are where the money is.
- Measure decision latency. It is the meta KPI that decides whether the other fourteen change anything.
About Tericsoft
We build fleet software around a simple conviction. A metric that no one owns and nothing acts on is not intelligence, it is decoration. Most platforms stop at showing you the number. We are interested in the ten minutes after the number goes bad, the escalation that reaches the right person, the decision that gets made, and the vehicle that gets back on the road. That is where fleet performance is actually won or lost, and it is the part most dashboards leave to chance. If your KPIs describe your fleet accurately but change nothing about how it runs, that gap is the problem we exist to close.

The five to start with are fleet utilization rate, vehicle uptime, cost per kilometre, the planned versus breakdown maintenance ratio, and revenue per vehicle per day. Each one needs an owner, a threshold, and an automatic consequence.
Preventive maintenance compliance rate, the planned versus breakdown maintenance ratio, mean time to repair, mean time between failures, maintenance cost per vehicle, and, for electric fleets, battery health degradation per vehicle. The planned versus breakdown ratio is the most revealing.
A good fleet utilization rate is 75% to 85% of available vehicle hours for commercial fleets. Below 70%, capital sits idle. Above 90% usually signals an undersized fleet. Track the bottom quartile of vehicles rather than the average.
Track between ten and fifteen, split by altitude. A handful for supervisors who act in minutes, a handful for operations heads who act across days, and a few for leadership who act across weeks. More metrics without owners and thresholds reduce action.
A fleet management KPI dashboard should show live operational metrics first, utilization, uptime, vehicles reporting, and active alerts, then daily and weekly metrics beneath. Every tile needs a threshold and an escalation path.