Why does a clean EV fleet total cost of ownership model so often disappoint in the accounts? Because the categories that decide it are the ones it leaves out.
EV fleet total cost of ownership models make the electric case look simple: cheaper energy, less maintenance, some incentives, done. The models are not wrong, they are incomplete. The categories that actually decide whether an electric fleet saves money are the ones the standard spreadsheet leaves out, and most of them only become visible when you attribute cost per vehicle across a real fleet. A clean TCO comparison can put a fleet into electrification on numbers that are true on average and wrong for a meaningful share of the vehicles.
This article is written from running the platform behind one of the world's larger electric deployments, a 3,000-plus vehicle fleet where every energy charge, battery signal, and hour of downtime is booked against the specific vehicle that produced it. The hidden categories below are the ones that surface once the costs are attributed rather than averaged.
What the standard EV fleet TCO model gets right, and leaves out
The standard model is a five-line comparison: purchase or lease, energy against fuel, basic maintenance, incentives, and a residual guess. On those five lines electric often wins, and for many urban, high-utilization duty cycles in markets with cheap off-peak power and live incentives, that conclusion is real.
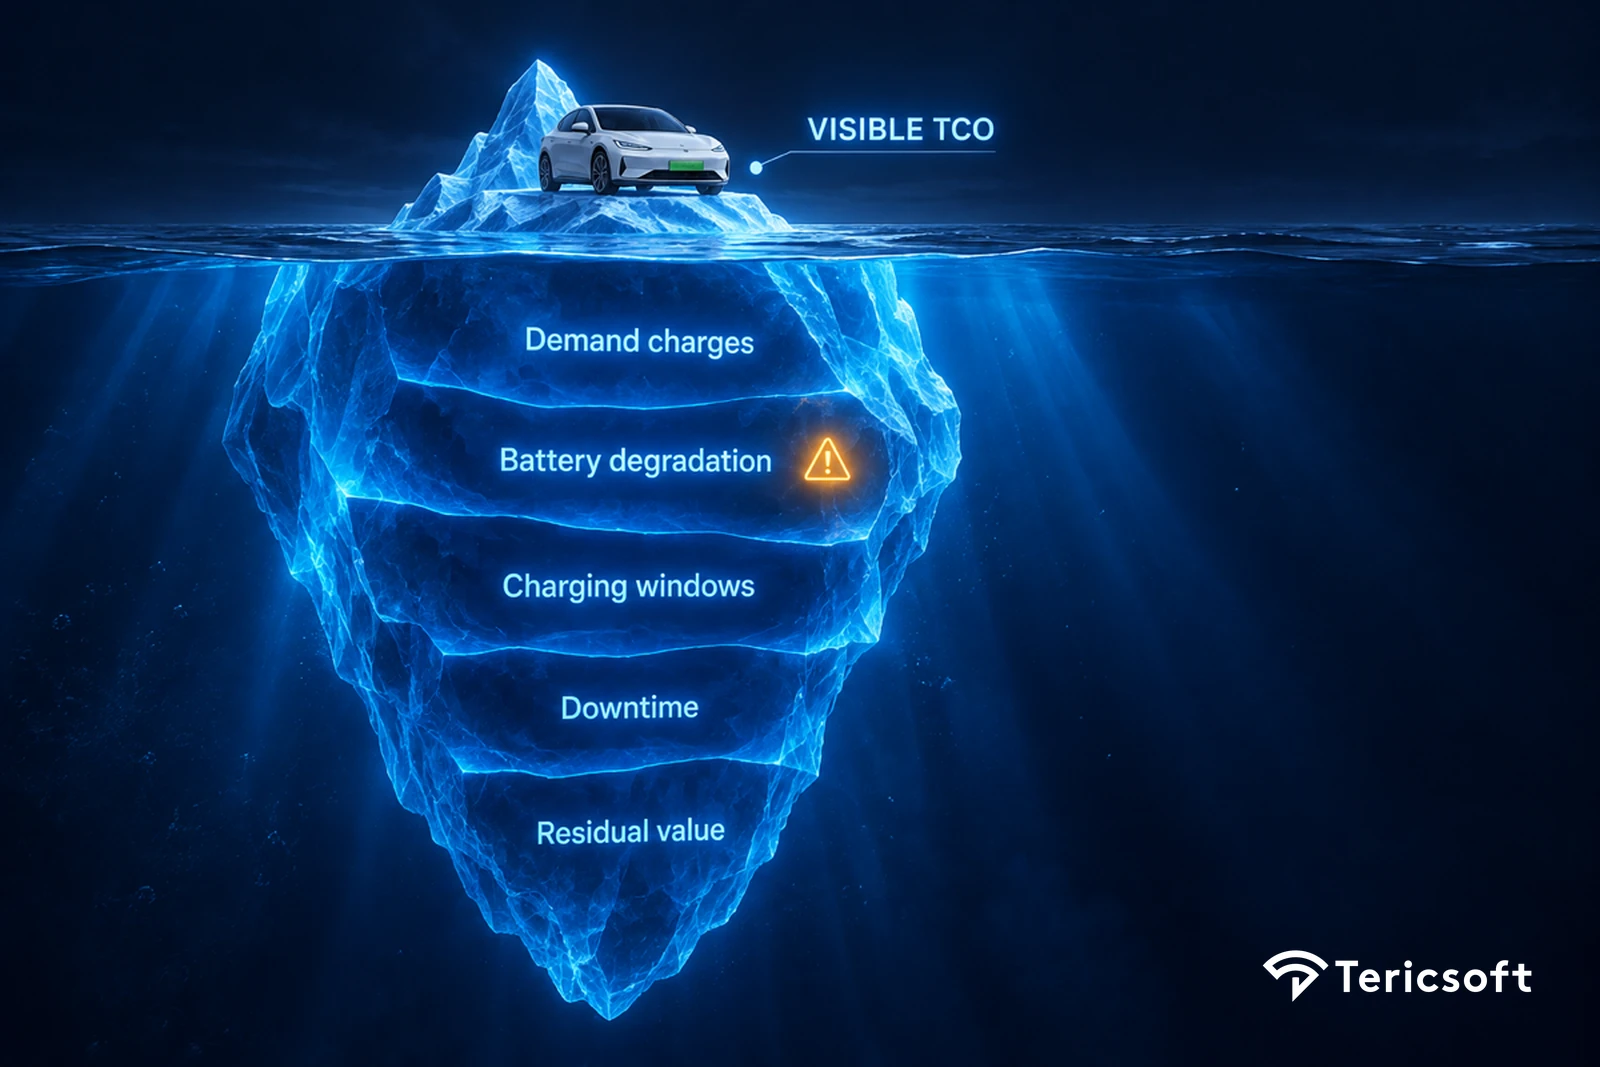
The trouble is what the five lines assume. They treat the fleet as one averaged vehicle, energy at a flat rate, a battery that never ages, chargers that are already installed and free to run, and every truck earning every day. None of that survives contact with an operating fleet. The categories below are where a confident TCO number quietly comes apart.
Hidden category one: charging infrastructure and demand charges
The first hidden cost is the one the vehicle price never shows: the depot. Chargers are capital before they are convenience, and the range is wide. The US Department of Energy puts Level 2 charging near 2,500 dollars per connector and DC fast charging at 20,000 to 60,000 dollars per connector, before any grid upgrade the site may need.
Then comes the trap almost no model prices. Plug the whole fleet in at 5 PM when the drivers get back, and the utility bills you a demand charge on that simultaneous peak that can rival the energy cost itself on the wrong tariff. On that kind of rate, the electricity is not the expensive part; the coincident peak is. A fleet that staggers and schedules charging avoids it. A fleet that charges on arrival pays it every month, and it never appears as a line item called charging.
Hidden category two: battery degradation and replacement
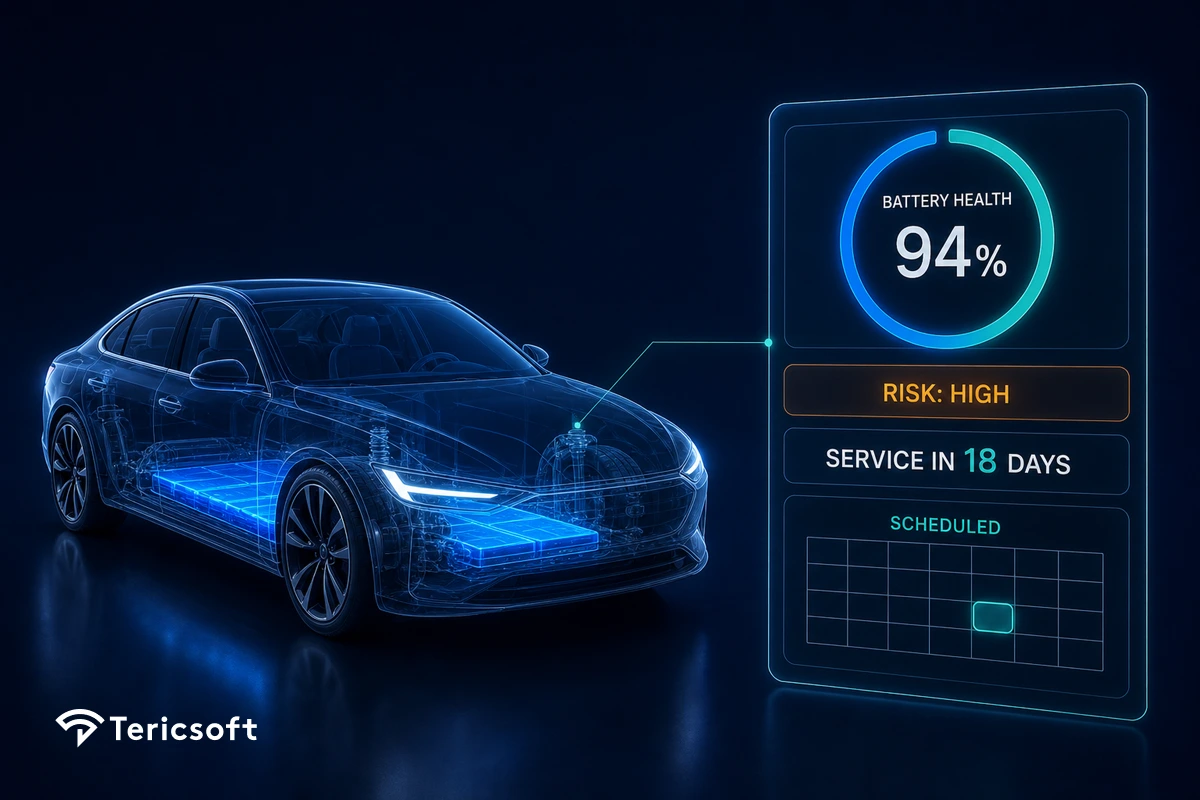
The battery is the most expensive component a fleet now owns, and the standard model treats it as if it were free after purchase. It is not. Industry estimates put the pack at 30 to 40 percent of an electric vehicle's value, and it degrades where no walk-around inspection can see it.
Degradation is a slow, uneven cost. Packs lose capacity across thousands of charge cycles, faster under heat, fast charging, and hard duty, and an EV battery replacement cost outside warranty is large enough to erase a year of energy savings on that vehicle. This is asset management for a balance-sheet item, not a maintenance line, and it is invisible to any TCO that stops at the sticker.
Hidden category three: charging-window energy economics
Electricity, unlike diesel, changes price by the hour, and that turns energy from a fixed input into a managed one. On a time-of-use tariff the peak-to-off-peak spread is wide, so charging into off-peak windows can cut the per-mile energy cost sharply against charging on peak, across every vehicle, every night.
The hidden cost is the gap between those two. A fleet that plans each vehicle's charging window against its next-day duty cycle captures the spread. A fleet that charges opportunistically donates it, quietly, on a bill that looks normal. Over a year and a few hundred vehicles, the difference between managed and unmanaged charging is a cost category in its own right, and the standard TCO assumes the good number for free.
Hidden category four: downtime, range, and utilization
A vehicle on charge is a vehicle not earning, and charging is measured in hours where refueling took minutes. If the charging schedule and the duty cycle are not planned together, the fleet loses utilization it never counts as a cost.
Range compounds it. A trip assigned beyond a vehicle's real remaining range does not run late, it strands, and a stranded trip is a towed vehicle, a missed delivery, and a scramble. Managing this is where route planning stops being a distance problem and becomes an energy problem. The opportunity cost of a badly scheduled electric fleet does not appear on any invoice, which is exactly why it is hidden.
Hidden category five: residual value and depreciation
Every TCO ends with a residual assumption, and for electric vehicles it is the softest number in the model. EV depreciation is still settling, resale values move with battery health and buyer confidence, and a pack that was run hot and fast-charged is worth less at exit even if it still drives.
That makes residual a category you manage, not a figure you guess. A fleet that tracks battery health per vehicle can time resale before the value curve steepens and can prove the pack's condition to a buyer. A fleet that cannot is left accepting whatever the market assumes about a battery nobody measured.
Hidden category six: the cost you cannot see because you do not attribute it
The last category is the one underneath all the others. Every hidden cost above stays hidden for the same reason: the fleet reports one blended TCO instead of cost per vehicle. Averaged together, a demand-charge problem on the depot, a degrading pack on one duty cycle, and a poorly scheduled charging window all disappear into a number that looks fine.
Attribution is what makes them appear. When every energy charge, battery signal, and downtime hour is booked against a specific vehicle, the fleet stops arguing about whether electrification pays and starts seeing exactly which vehicles, classes, and routes pay and which do not. The most expensive hidden cost in an electric fleet is not any single category. It is not knowing, per vehicle, which category is bleeding.
What running 3,000 EVs taught us about TCO
Across the deployment behind this article, more than 1 billion telemetry events a month are normalized across multiple manufacturers into one model, held at over 98 percent real-time visibility. For this fleet, in its markets and duty cycles, the blended TCO does favor electric, in line with what the calculators promise. The variation underneath it is enormous, and only attribution shows it.
Some vehicles and duty cycles beat their diesel equivalents comfortably. Others, the ones with heavy fast-charging, hard routes, and unmanaged charging windows, sit close to break-even once the battery and demand-charge costs are attributed to them. The spread in attributed cost per mile between the best and worst duty cycles is wide enough to change which vehicles the fleet keeps and which it retires early. Charging discipline is run as a profit-and-loss line rather than a driver habit, and battery-signal anomalies are flagged 2 to 3 weeks before they become failures. None of that is possible from a blended average. The lesson is not that EV TCO is bad. It is that the honest number is a distribution, not a single figure, and you can only manage the tail you can see.
Key takeaways
- The standard EV fleet TCO model is true on average and wrong per vehicle. The five-line comparison hides the categories that decide the outcome.
- The hidden categories are real money. Demand charges, battery degradation, charging-window economics, downtime, and residual risk each move the number materially.
- They stay hidden because the fleet averages them. Cost per vehicle is what turns a blended TCO into a decision you can defend.
- Electrification wins for the right duty cycles, if you manage the tail. Whether EVs beat diesel turns on duty cycle, utilization, power price, and incentives, and only a fleet that attributes cost per vehicle knows which of its vehicles clear the bar and by how much.
About Tericsoft
Tericsoft does not sell chargers, batteries, or a per-vehicle subscription. We build the data layer underneath an electric fleet, where an energy charge, a battery signal, a charging window, and a trip are one record rather than five disconnected ones. That is what turns EV total cost of ownership from a spreadsheet average into a per-vehicle number a fleet can act on. If your electrification case looked clean on paper but murkier in the accounts, that gap between the model and the ledger is the problem we engineer for.

Lifetime cost of an electric fleet: purchase, energy, maintenance, infrastructure, battery, downtime, and residual, net of incentives.
Charging infrastructure and demand charges, battery degradation, charging-window energy economics, downtime, and uncertain residual value.
Depends on duty cycle, utilization, power price, and incentives. Urban high-utilization fleets usually win; fast routes near break-even.
Enough to erase a year of energy savings. At 30 to 40 percent of an EV's value, an out-of-warranty swap is a balance-sheet event.
Utility fees based on your highest simultaneous power draw. Charging a whole fleet at once at shift end can rival the energy cost itself.